
This is a continuation of the original article describing the app :
https://kerpanic.wordpress.com/2018/12/20/trading-the-trade-war-sentiment-based-trading-using-google-trends/
If you have not read the previous article, I highly recommend to read that first as it serves as an introduction to the web app at https://tradewargoogletrends.herokuapp.com/!
New Features and Parameters
Since the original web app was released, some requests and suggestions have come in, and some new world events like the increase in the federal reserve rates and several Trump antics have occurred. Here are the all the updates to the web app.
- Using Google Trend Topics instead of Search Terms: Topics in Google Trends are more all-encompassing as they cover all the terms related to the word topic you chose. Hence, to cover more ground I chose to convert getting the search terms previously to topics. A detailed difference between search terms and topics is listed here.
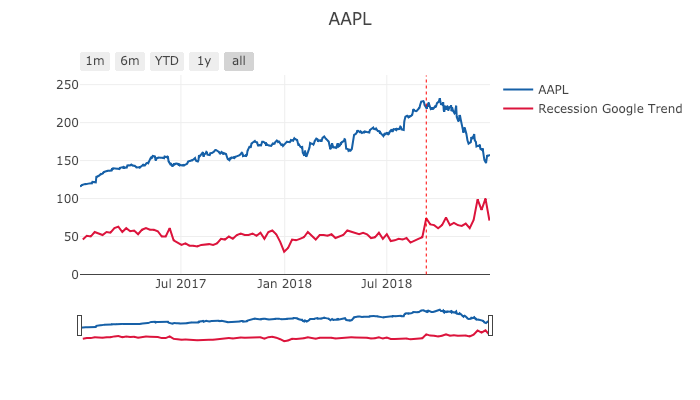
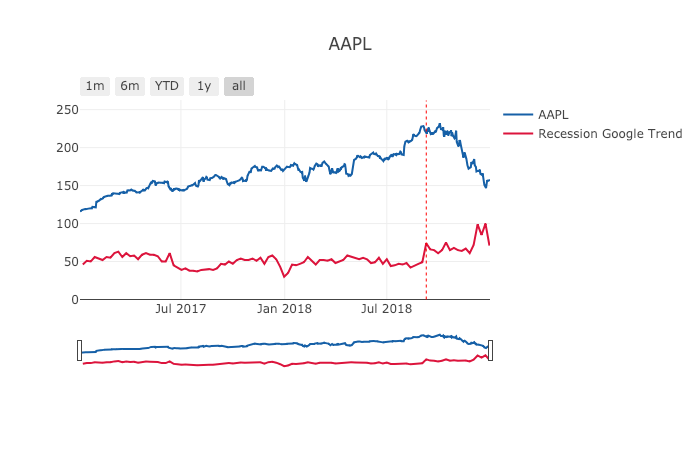
- Other Keywords : In the previous version, the keyword was limited to “Trade War”. Now the new keywords include : “recession”, “financial crisis”, “debt”, “federal reserve system” and also something to satisfy these two best friends (look for it!). These are terms which are related somewhat to the trade war, and allows us to expand upon the analysis of how Google Trend sentiment affects the market prices. It is interesting to see how these terms correlate to the ups and downs of the individual stocks, especially now that we are in a volatile period of time. I personally like “financial crisis” or “recession” as a “chicken-little” warning indicator – try it out!
- Wider Range for Parameters: In order to deal with the behaviour of different keywords, a wider percentage range for “Upper Sell Threshold” and “Lower Buy Threshold” has been included.
- More Tickers : There are more tickers now of popular stocks, including the S&P500 and Dow indexes. I’ve also added the tickers of those stocks I have a personal interest in.
- Lighter red/blue line to indicate triggers on partial data: Google trend values actually measure the proportion of that particular keyword search in relation to all the other searches in Google. This means when Google Trends states that the latest data is partial data, we cannot reliably say that it is a buy or sell trigger should it cause a trigger. We can only say it is “headed that way” and we can only confirm it when the end of the week it is measuring is reached. Thus, a lighter blue/red line indicates such a situation.
- Date Picker for Date From Which to Start Calculations: This states the point in time at which we start the buy/sell calculations. It will come in useful if you want to test the Google Trend strategy from a different point in history.
- Addressing Heroku App Startup Times: If you are on the free tier of Heroku, it seems that the app automatically sleeps if it is idle for 30 minutes, after which there is a 10 second startup time for the first time the app is accessed. By pinging it at regular intervals with https://uptimerobot.com you can keep it alive to maintain the responsiveness of the app. I am really cheap.
- Oh, if only I had sold …
Thoughts
The more I mess around with the web app, the more I believe in its ability to draw from the wisdom of the crowd. That said, not all the keywords presented seem effective, and I leave it to your own judgement to see which ones are. Personally I think “trade war” , “financial crisis” and “recession” seem to correlate best with trends in the market, but YMMV. Perhaps a reason for this is that these are terms most people can relate to and search for.
Essentially, the Google searches represent the sentiment of the people, albeit on a weekly aggregation. At the very least, I will look at what these graphs say before I make any buys or sells, especially in these turbulent conditions to gauge how as a whole all of us are thinking.
One drawback though, is that the Google trends are coming in on a weekly basis, which may be too slow compared to the volatile market in this climate. Perhaps a further step could be to get wiki search trends (these are available daily, I think), or to analyse trump’s incessant tweets to further confirm the positive/negative sentiments at that point of time. The possibilities are endless, and I am positive that the professionals quantitative analysts out there are doing more than this.
All that said, if you mess around with the app enough, you’ll find that buy-and-hold is still a pretty solid strategy!
